Installing and using vnStat and vnStati for Monitoring Network Traffic in Ubuntu
Monitoring Network Traffic or Bandwidth Usage is an important task in an organizational structure or even for developers. It is sometimes required to monitor traffic on various systems which share the internet bandwidth. There might be situations where network statistics are required for decision making in the networking areas or use the logged information on the network traffic for analysis tasks.
vnStat and vnStati are command line utilities which are very useful tools that help a user to monitor, log and view network statistics over various time periods. It provides summaries on various network interfaces, may it be wired like "eth0" or wireless like "wlan0". It allows the user to view hourly, daily, monthly statistics in the form of a detailed table or a command line statistical view. To store the results in a graphical format, we can use the vnStati to obtain and provide a visual display of statistics in the form of graphs and store them in the form of images for later use.
This post deals with the procedure to install and use vnStat and vnStati. It also details the options and usage methods required to view and store the type of information you want. vnStat does most of the logging and updating, whereas vnStati is used to provide a graphical display of the statistics.
The steps in this tutorial have been tested with Ubuntu 16.04 and 18.04.
2 Installing vnStat and vnStati
To install the two command line tools use the following two commands:
sudo apt-get install vnstat
sudo apt-get install vnstati
Enter your password and wait for it to install. Once done, test if it has installed correctly by typing "vnstat" and "vnstati" in the terminal. There shouldn't be any error displayed saying, "vnstat not found" or "vnstati not found".
3 vnStat setup and running
Once the installation is complete, vnStat has to be set up or configured as it does not start on its own. vnStat has to be told explicitly which interfaces have to be monitored. We then start the vnStat daemon called "vnstatd", which starts vnStat and monitors for as long as it is not stopped explicitly.
Before we start configuring vnstat, use ifconfig to get the name of the network interface that we want to monitor.
ifconfig
The result on my system is:
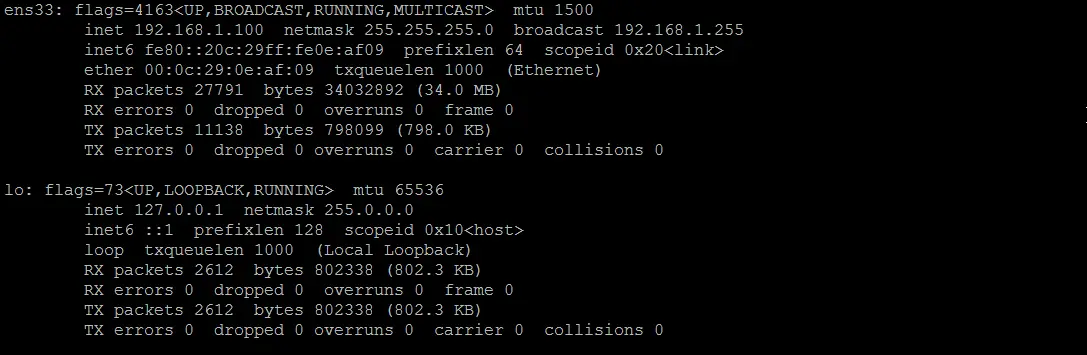
So my main network interface has the name ens33.
The first thing to do here is telling vnStat the network interfaces to monitor. Here we look at a wired interface "ens33" and a wireless interface "wlan0". Type the following commands in the terminal.
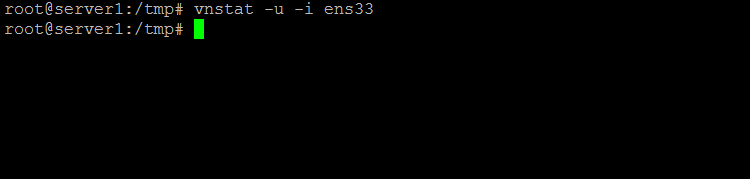
vnstat -u -i ens33
This above command activates monitoring that interface. The first time you run this command on any interface you might get an error saying 'Unable to read database "/var/lib/vnstat/ens33" '. Please ignore this. Refer to the image below.
Similar to above, you can also set the wireless network interface using the command if you have a WLAN:
vnstat -u -i wlan0
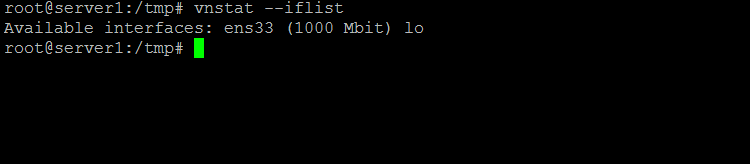
To view all the network interfaces available in your system, use the command:
vnstat --iflist
Once you know all the interfaces that you want to be monitored, use the command above with that interface name to monitor the traffic on it. Below is an image of the available interfaces in my system, Yours might be similar.
Once the above steps are complete, we can now start the vnStat daemon. To do this, we use the following command:
sudo service vnstat start
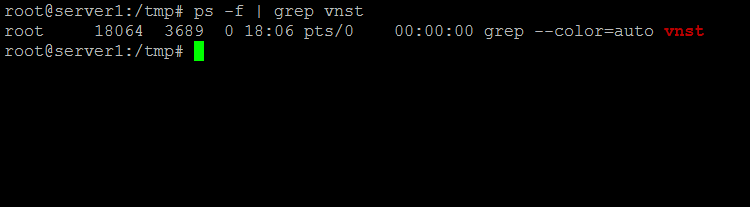
You can check to see of the daemon process is running, by using the following command and the image of the output is shown below that:
ps -f | grep vnst
4 Using basic features of vnStat
The most basic usage of vnStat is opening a terminal and executing the command:
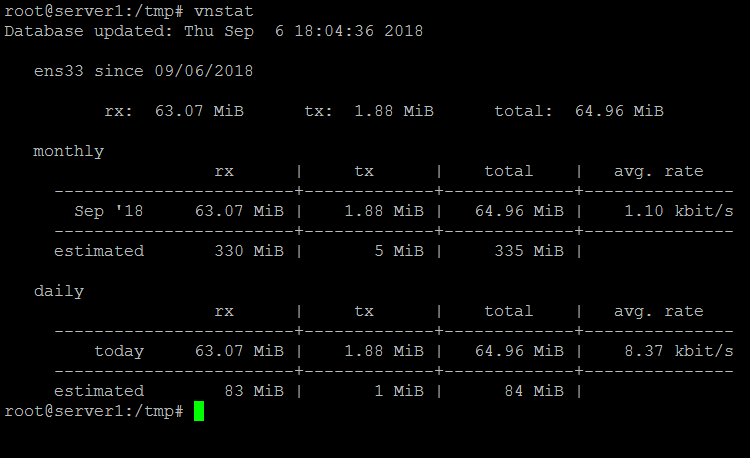
vnstat
This gives a month wise summary of total network traffic from all the registered interfaces. I have added an image of my network traffic. You can see below that for the network interface "eth0", it says "Not enough Data available yet". This is because I enabled traffic monitoring for eth0 just while I was writing this post. So, if you have enabled it recently, both eth0 and wlan0 will show that there is not enough data. But soon after using the internet for a while it will change and will look similar to "wlan0" below:
For specific but basic usage you can monitor specific network interfaces by using the "-i" option. So, the command for ens33, will be like:
vnstat -i ens33
Replacing the "ens33" from above command with any other interface like "eth0" or "wlan0" will give the statistics for that interface. An example for "ens33" is shown below. Depending on when you have started vnStat and the usage of your network it might look similar to one or both of the images below.
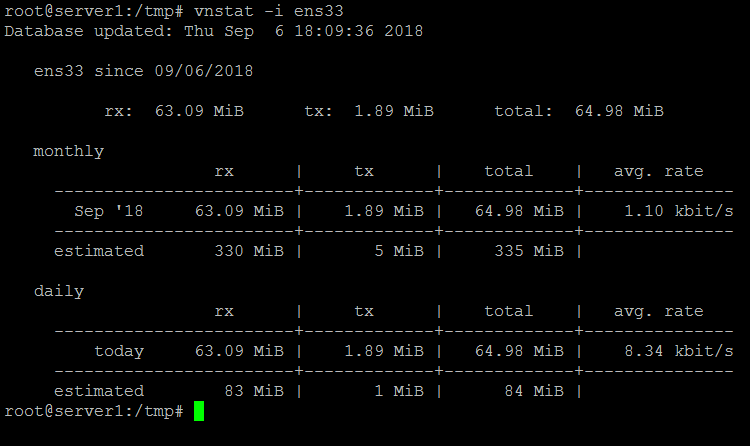
It can be seen that at the end on each table, vnStat provides an estimated network usage of the month. Sometimes this is very useful and helps the user to control the bandwidth usage. This is one of the many useful features of vnStat.
5 Specific usage of vnStat
Here we will monitor traffic at specific time periods and for one particular interface. Since I have quite a lot of logged statistics for the "wlan0" interface, I will be giving examples for that, but it can be assured that it will work the same way for all the interfaces. so, let's begin:
5.1 Hourly statistics
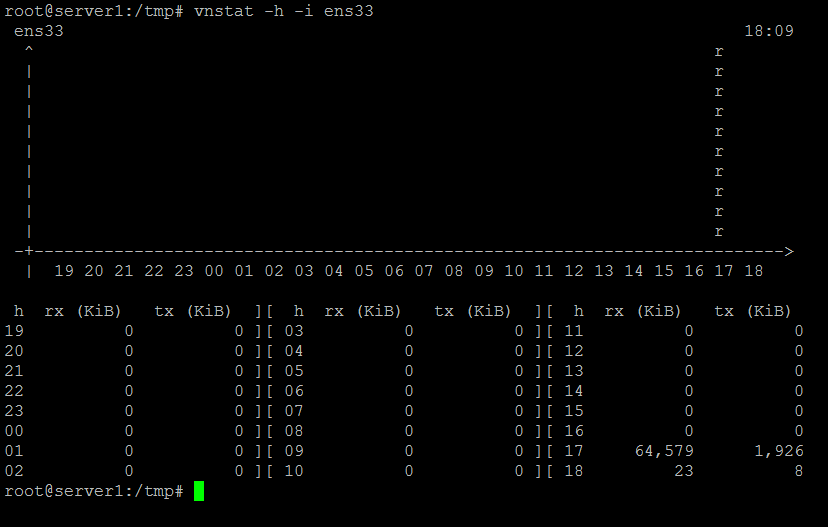
We can view hourly statistics in the form of a console-based graph followed by a table representing the usage for the last 24 hours. We can use this by using the "-h" option. Use the following command:
vnstat -h -i ens33
So, you can replace the "wlan0" with say "eth0" and you will get the result for that. The image below shows the wlan0 hourly statistics for my system.
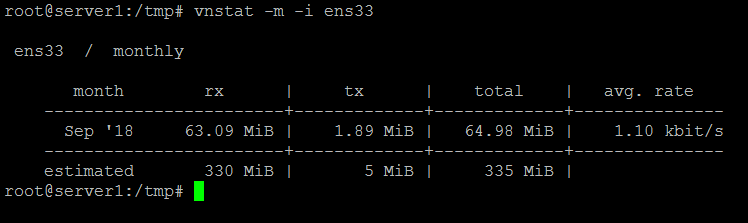
5.2 Monthly statistics
using the "-m" option we can view the monthly statistics. The command followed by a screenshot representing monthly stats is shown below.
vnstat -m -i ens33
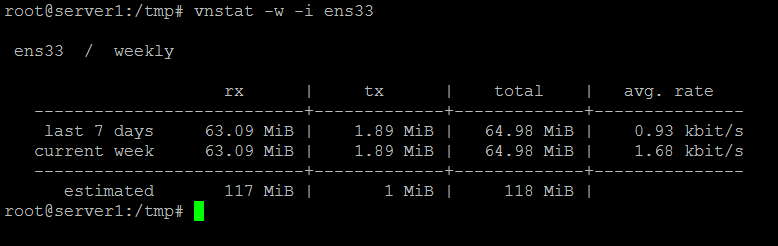
5.3 Weekly statistics
We can use the "-w" option to view the weekly statistics for an interface.
vnstat -w -i ens33
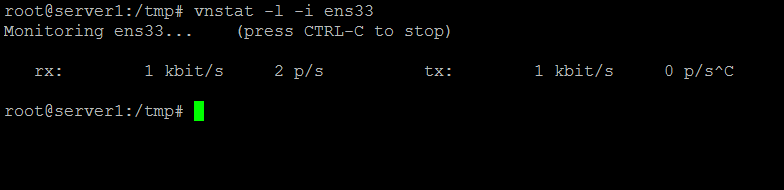
5.4 Top 10 stats and live monitoring
Live bandwidth usage can be monitored by using the "-l" command and top 10 days with the highest traffic can be monitored with the "-t" option. The commands for doing that are:
vnstat -l -i ens33
vnstat -t -i ens33
6 Using Vnstati
vnStati is used to produce graphical images representing the network traffic as graphs. It takes the required information to create graphs from vnStat and stores it in the specified location.
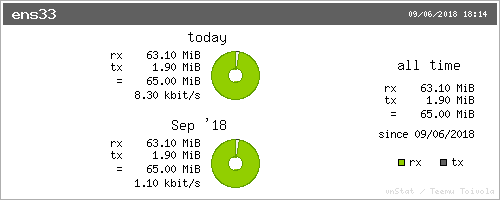
6.1 Output of summary for an interface
To take the output of a particular interface, we can use the "-s" option of vnStati. We will also be using "-o" option to specify where the output file will be stored. To get the output and store it as an image called "summary.png" in the home folder, use the following command (the output for my system is below):
vnstati -s -i ens33 -o ~/summary.png
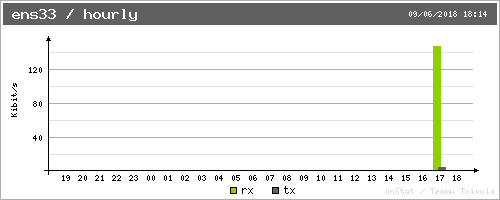
6.2 Hourly display of stats
We can use the "-h" option to get the output for hourly display. The command and output are shown below. The display is always for the last 24 hours.
vnstati -h -i ens33 -o ~/summary2.png
6.3 Cumulative output
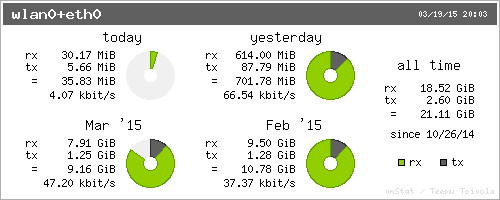
It is possible to get the total output by combining the traffic analysis of multiple interfaces. For example "eth0+eth1" gives the output for the traffic by summing up the stats from eth0 and eth1. Similarly we can add up any number of interfaces like "eth0+eth1+eth2" or "eth0+wlan0", etc. Below is an example and command:
vnstati -s -i wlan0+eth0 -o ~/summary3.png
7 Conclusion
From the variety of information that we can log and analyze and produce by monitoring network traffic makes the combination of vnStat and vnStati a very powerful and useful toolkit. This can be used in an organization too as it provides accurate results. The live monitoring can be verified with other tools to prove its accuracy. And since it logs all the information, the analysis can be done for a time period somewhere in the past. Lots more information about the usage and options can be found out in the vnStat man page.

