How to monitor your system performance on (Ubuntu) Linux
On this page
Monitoring your Linux system is essential in order to be able to improve its performance, locate the source of a problem and take more targeted corrective actions. As is always the case with Linux, there are quite a few tools and many different ways you can utilize to monitor different aspects of your system's performance. On this simple guide, we will take an overall look on how to install and run three monitoring tools on an Ubuntu Linux system.
GNOME System Monitor
The first tool that you can use to get an overview of the use of your system's resources is GNOME's system monitoring utility. With it you can determine the CPU load, RAM use, Swap file use, Hard Disk size and available space, and finally the Network activity (sent/received).
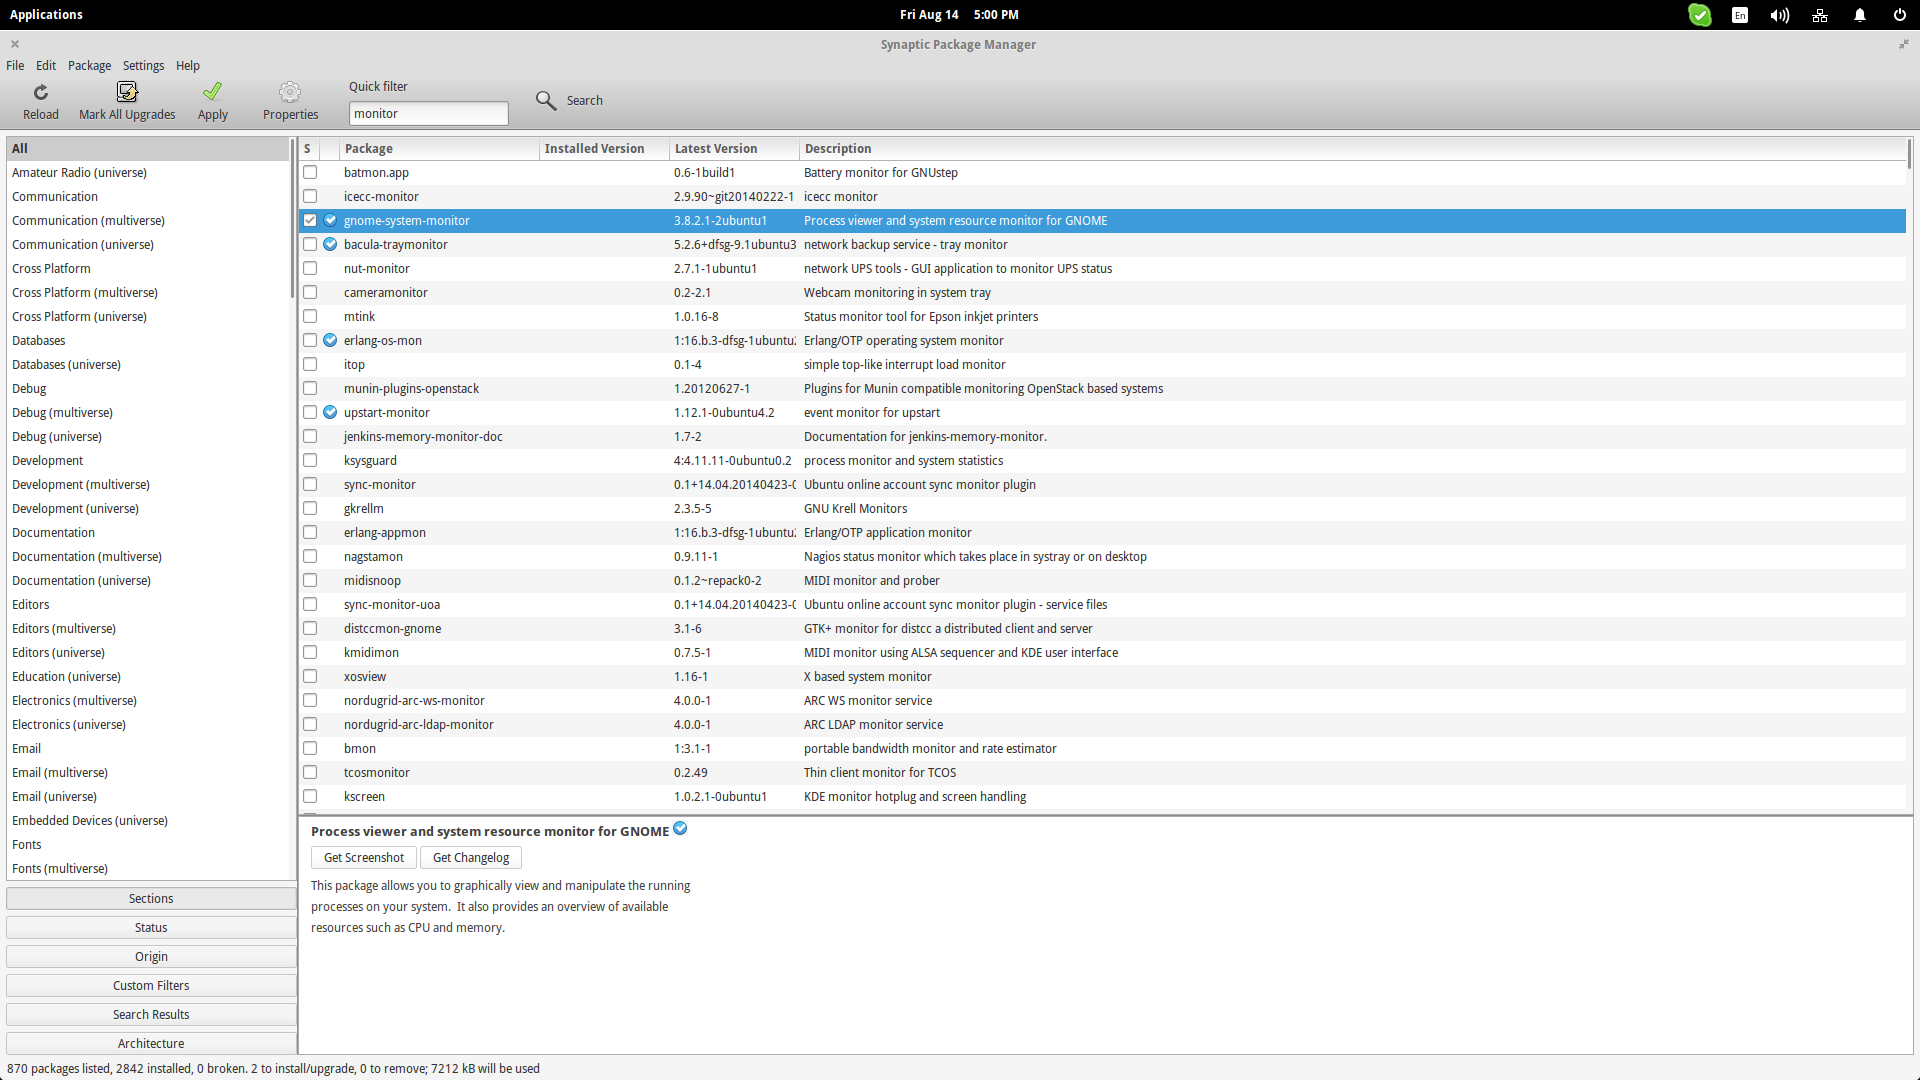
You may install this tool by choosing it on your package manager, or by entering the following command on a terminal:
sudo apt-get install gnome-system-monitor
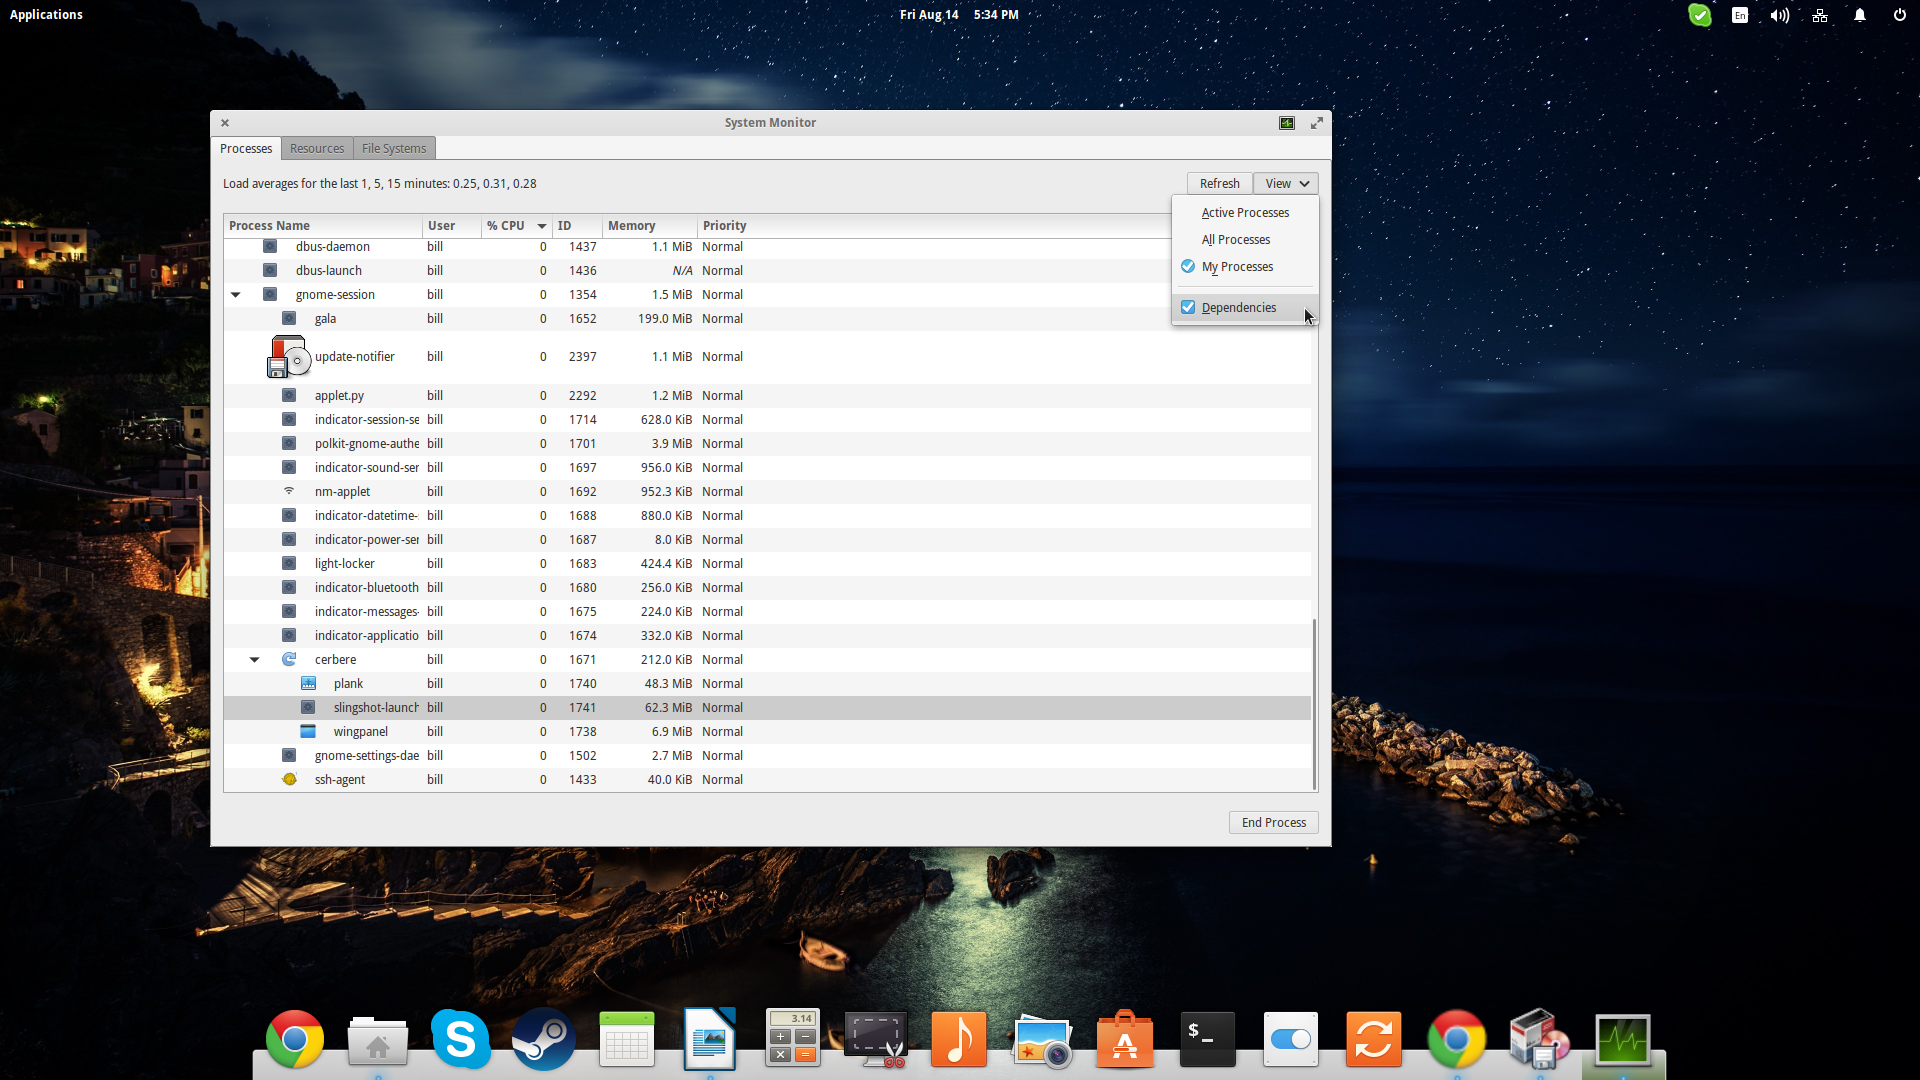
The first tab of the System Monitor is dedicated to process management. You can check what is running in your system, sort them by RAM usage or CPU load, and press the “End Process” button on the bottom right to kill the selected/highlighted entry from the list. You can also enable the “Dependencies” parameter on the “View” menu to see the child processes in a tree-like view.
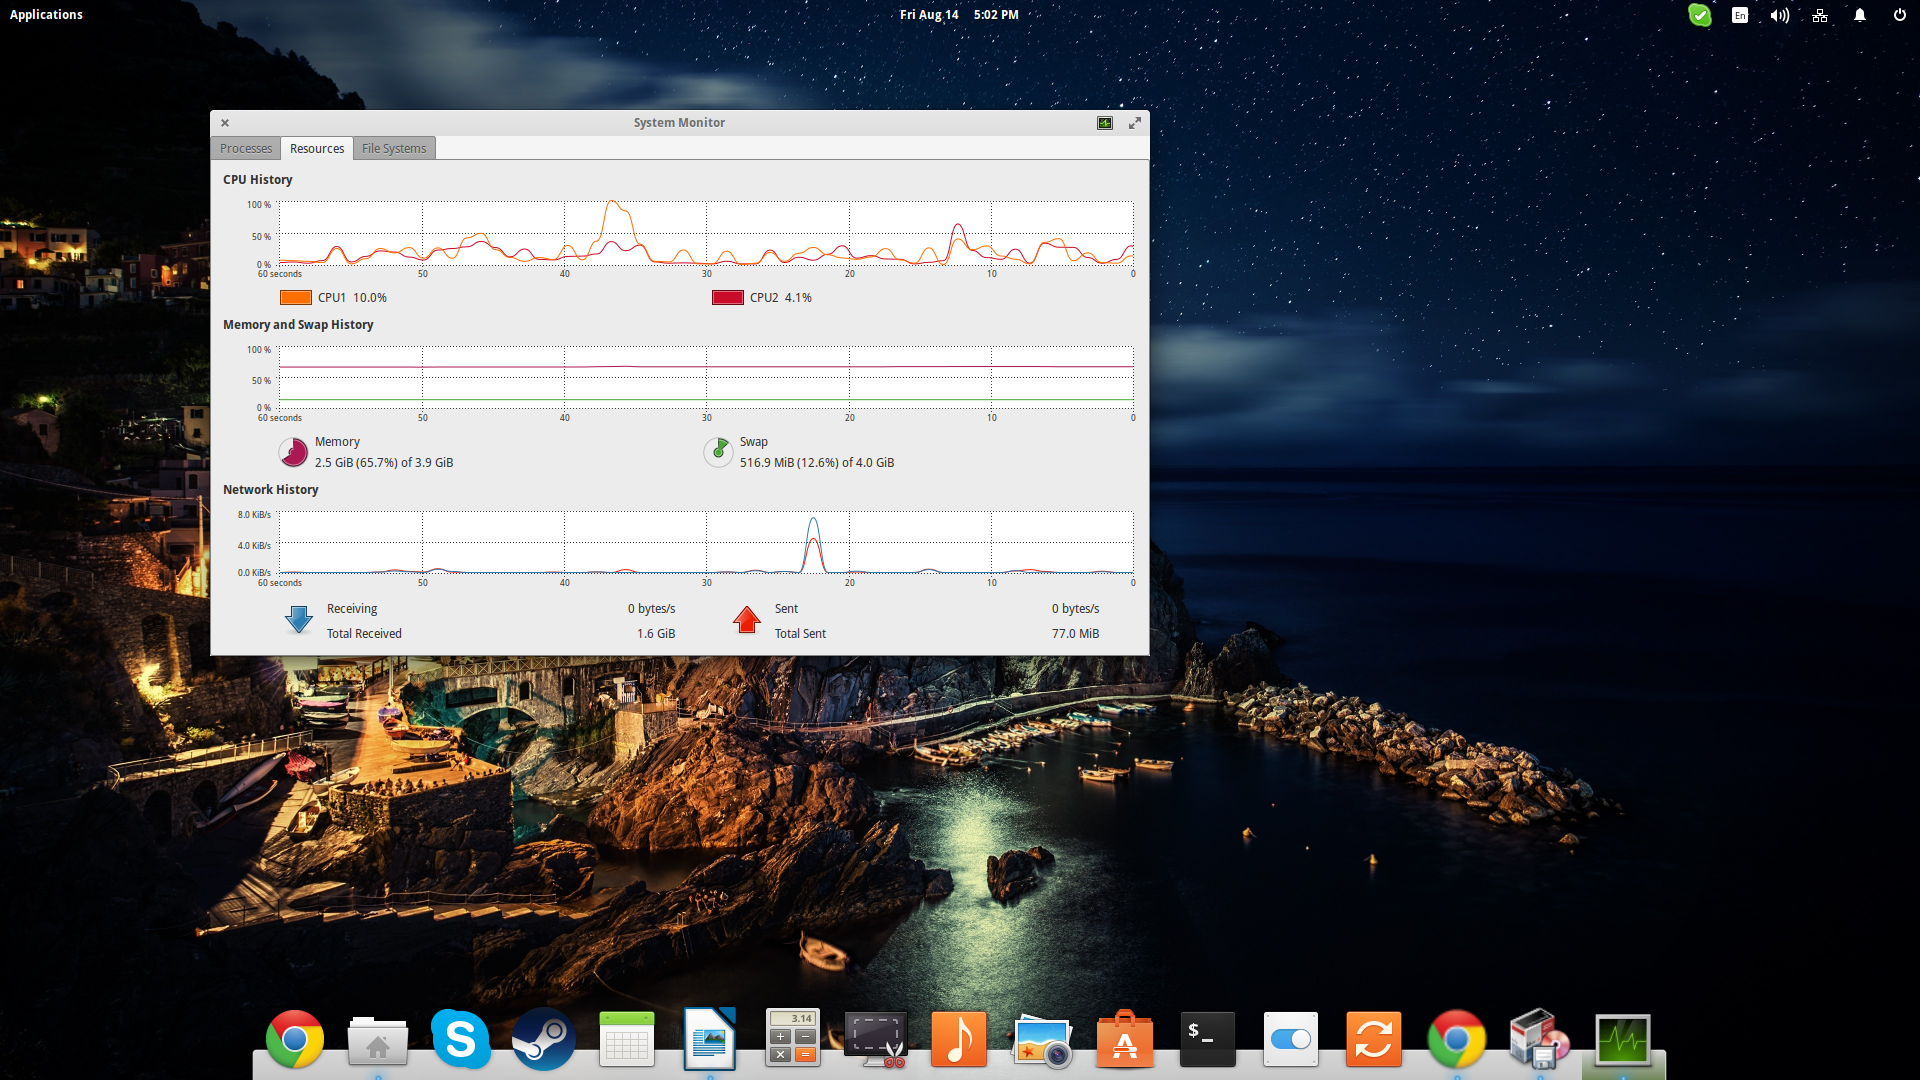
The second tab depicts the usage history of the system's CPU (with core load represented individually), RAM and Swap as well as Network activity. This part of the tool is especially useful when wanting to locate a performance-hindering action. It would be even better if we could increase the history time frame shown, but unfortunately, the preferences don't allow for such a setting.
Top and Htop
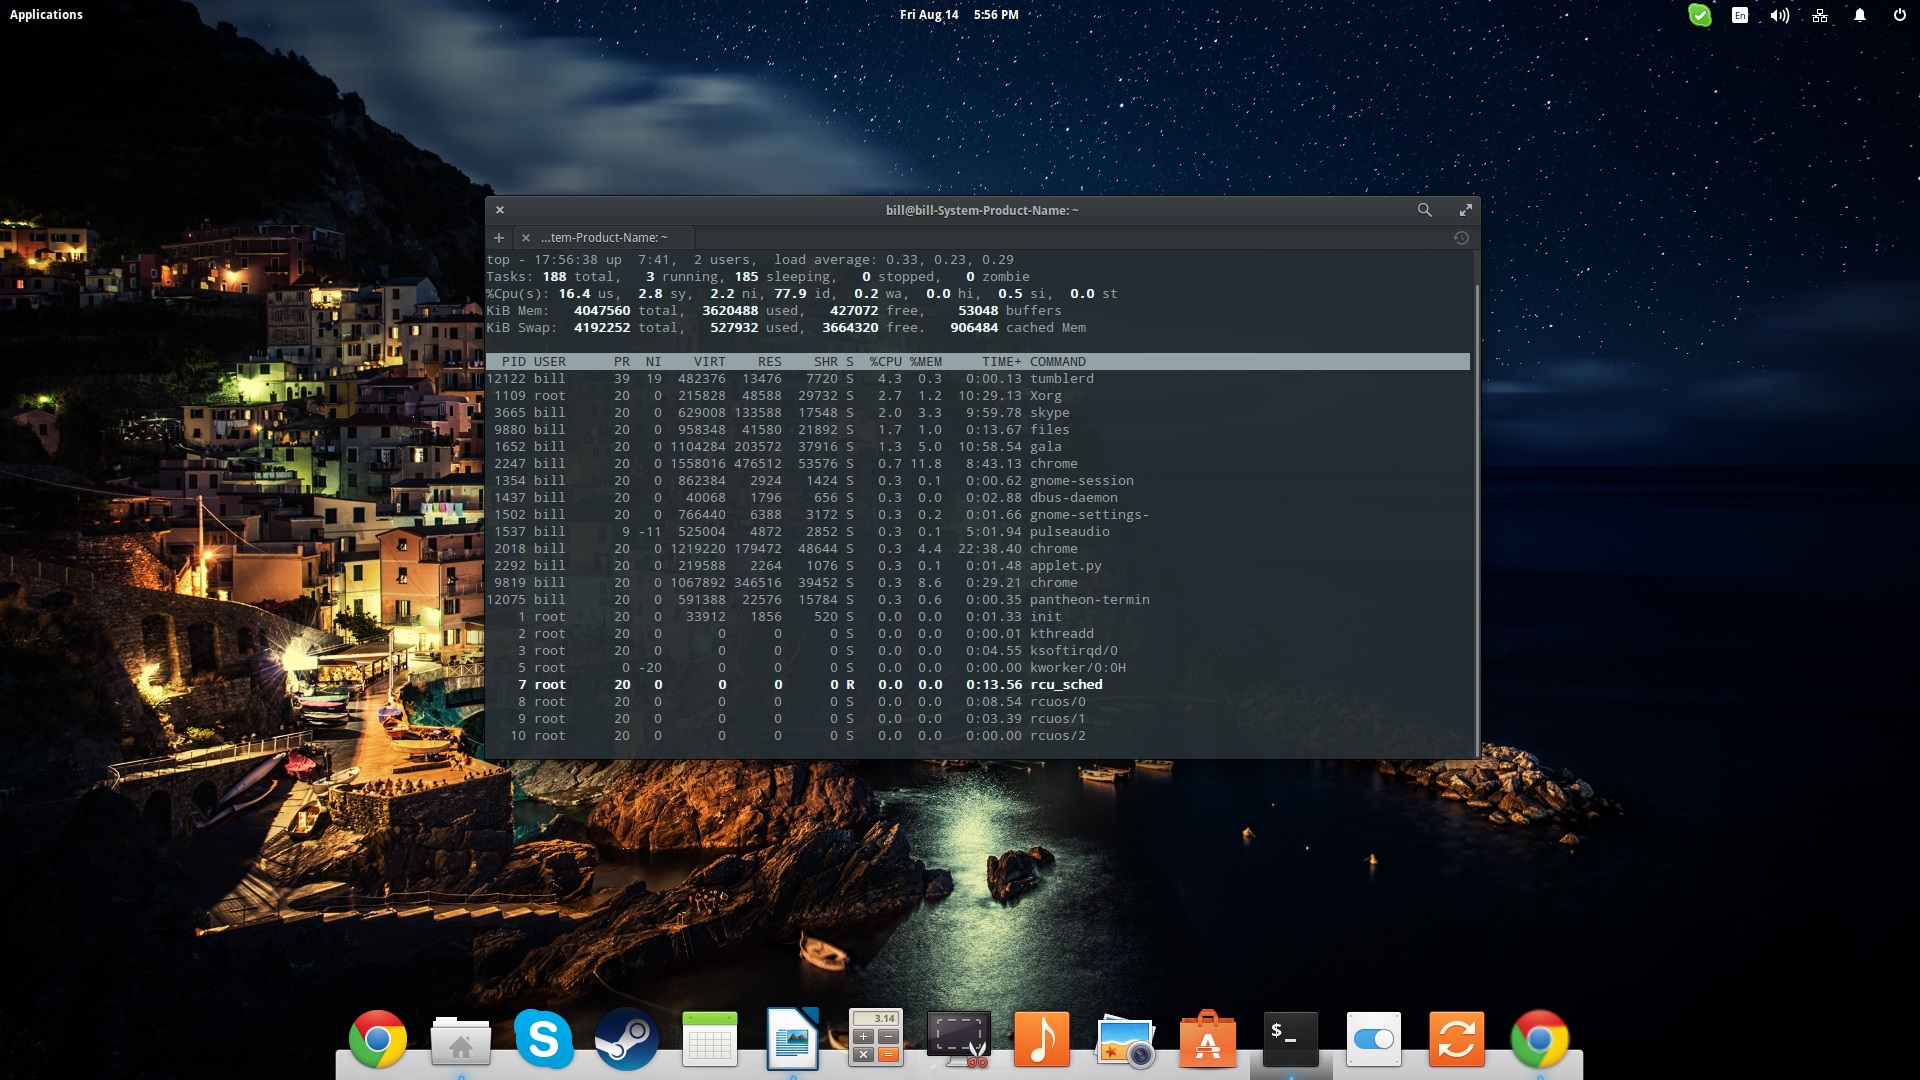
A much more “handy” and straightforward approach on system monitoring is to simply open a terminal, type “top” and hit enter.
top
This will display all processes currently running in your system. If you want to sort the processes by size, press “P” and you're done.
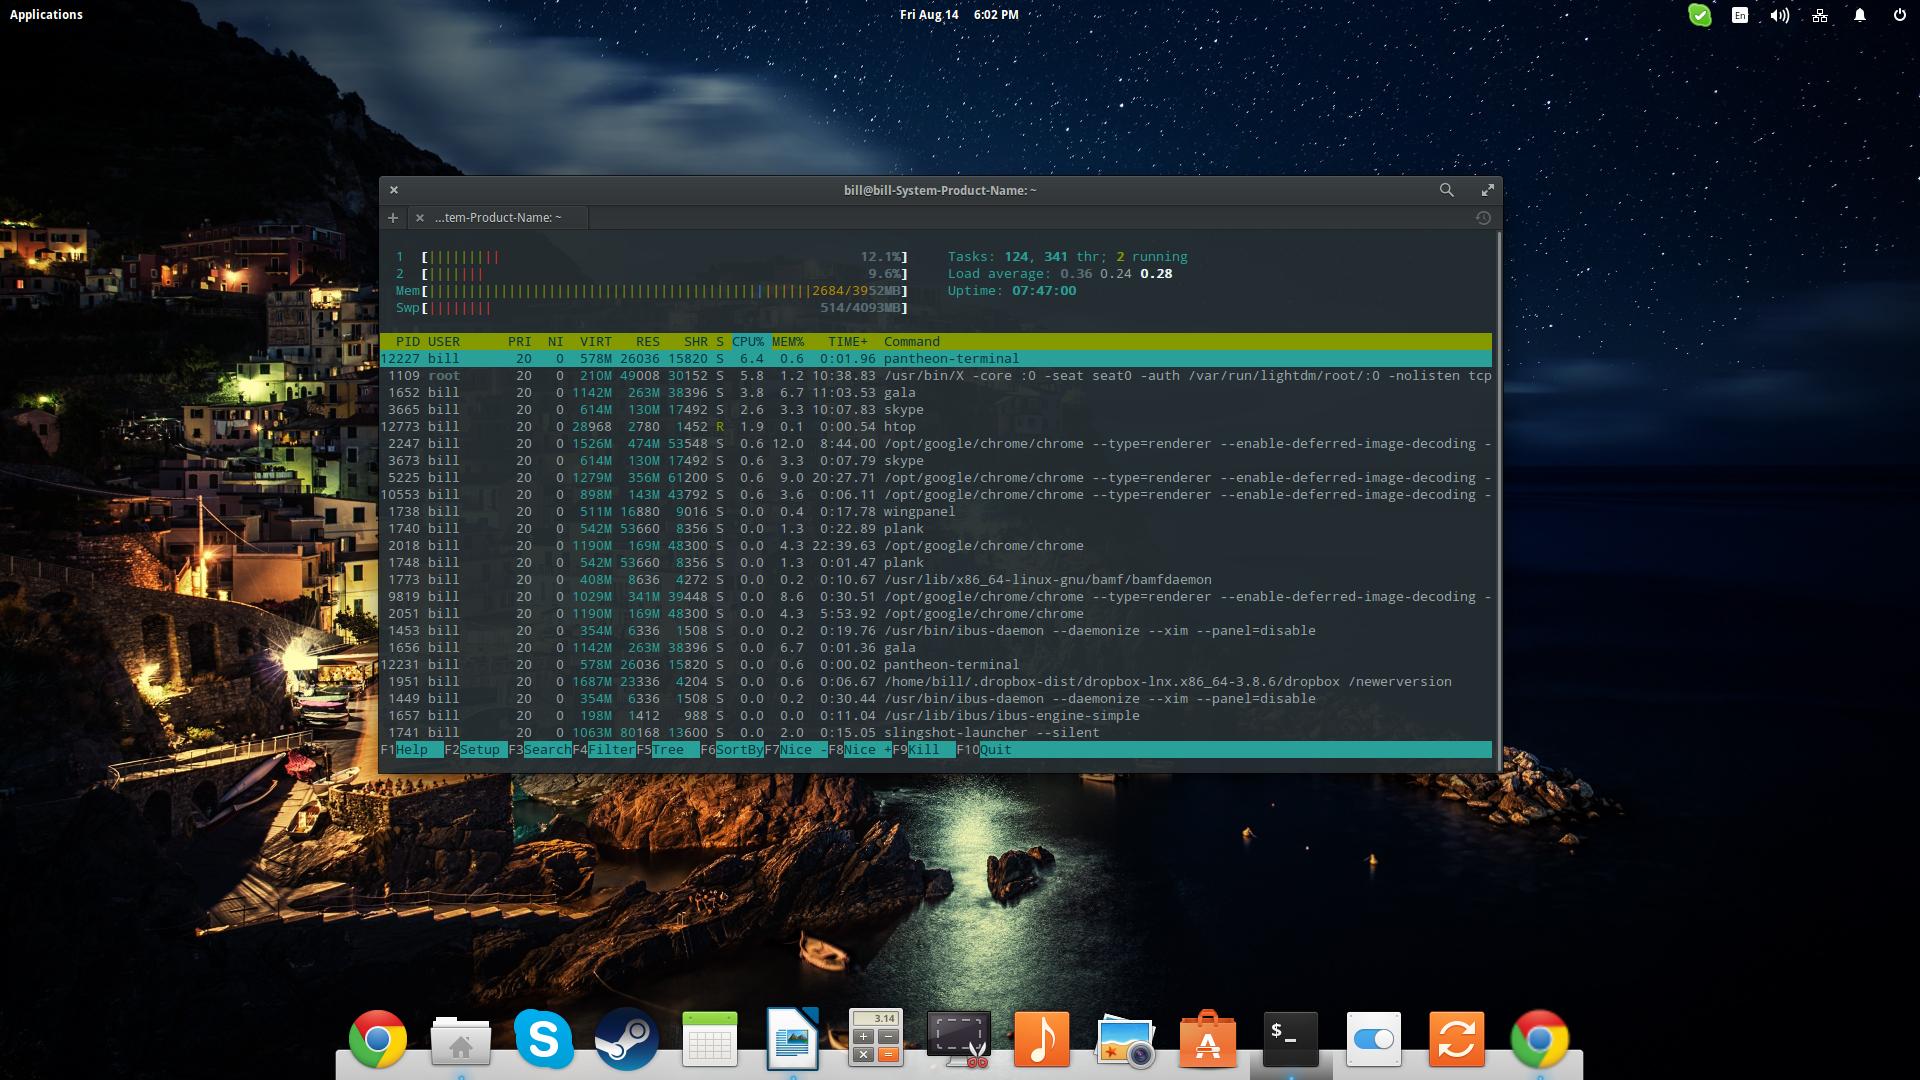
If top looks good, you should try htop which is even better! Install it by “sudo apt-get install htop” and run it on the terminal again.
sudo apt-get install htop
htop
Contrary to “simple” top, htop has some added features that make sorting by different factors easier, killing processes quicker and even some display options to make it look better. You can access its options using F1-10 as indicated on the bottom of the terminal.

Lm-sensors
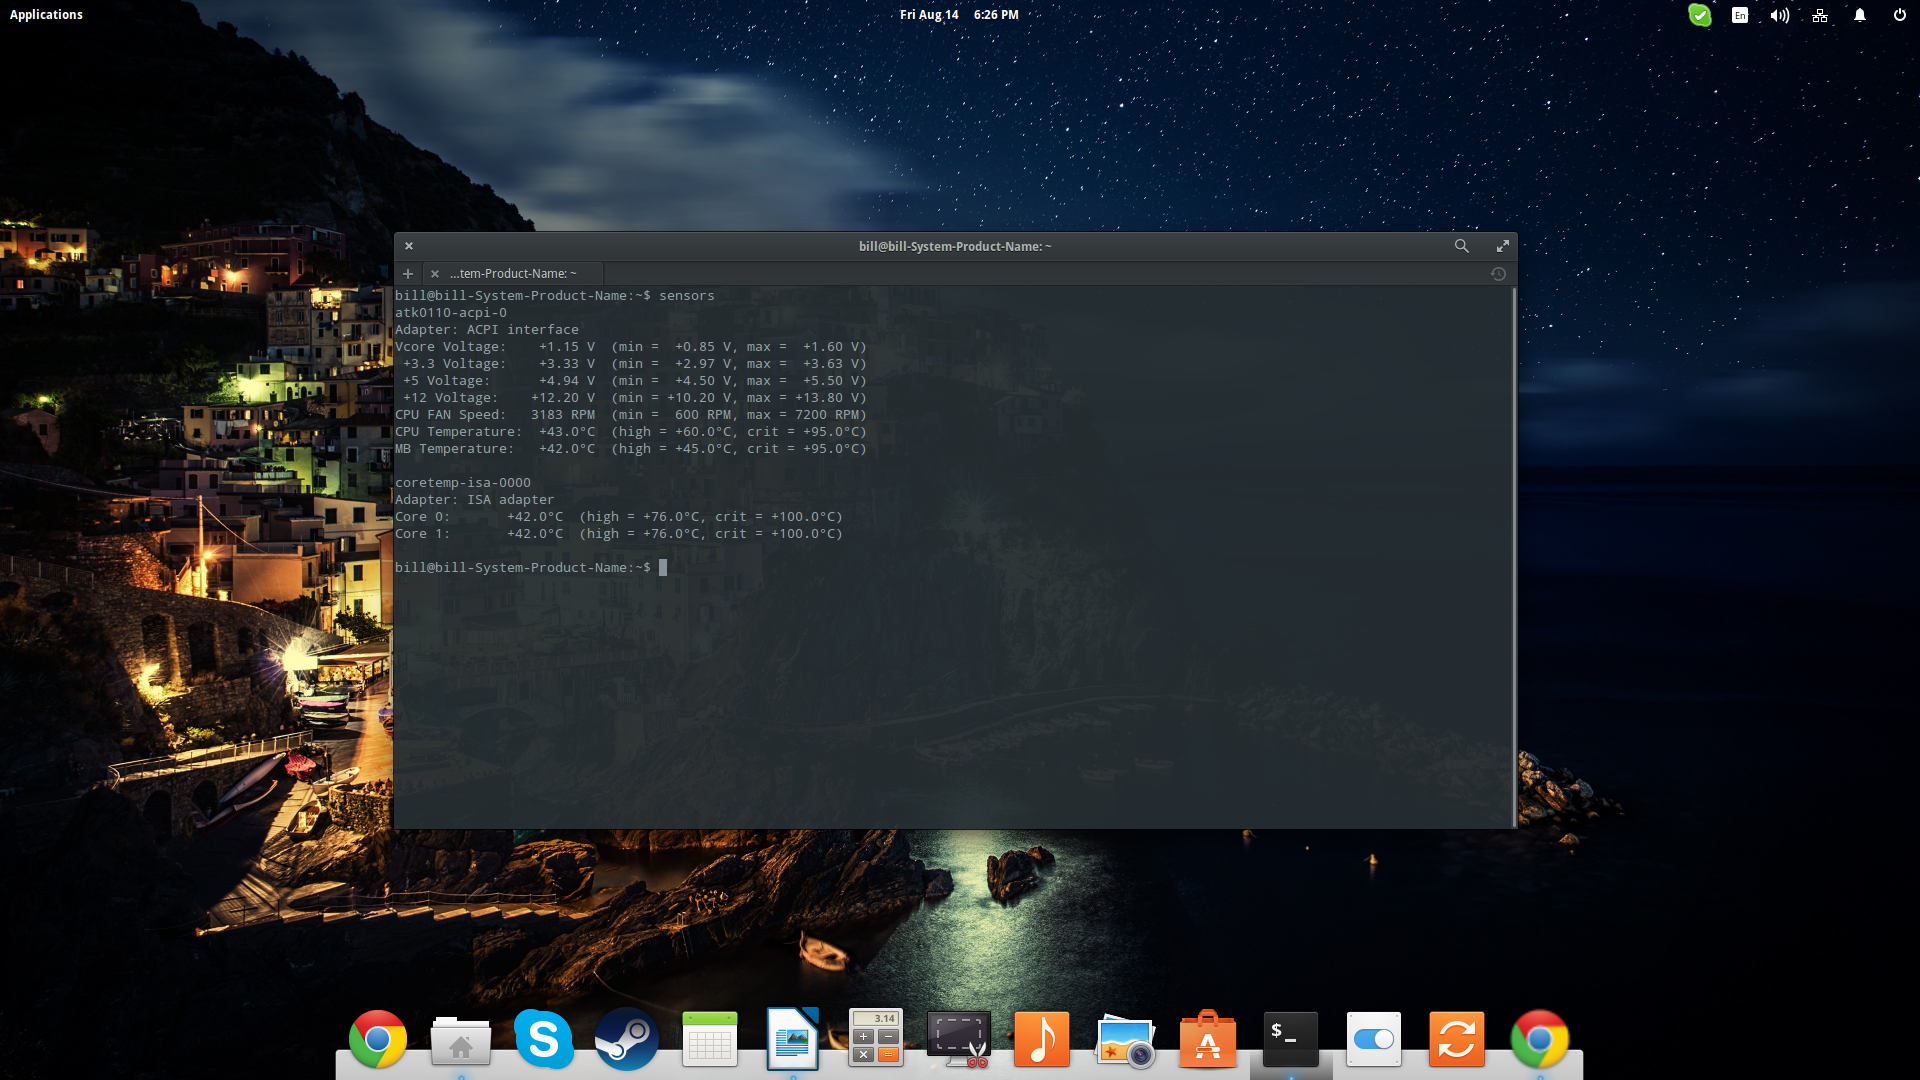
Finally, you should be aware of another useful terminal utility that is of a different kind than the above. Lm-sensors help you monitor your system's hardware temperatures and voltages. To get them, you can enter the following command on a terminal:
sudo apt-get install lm-sensors
Then you may simply type “sensors” on a terminal and some key info will be displayed.
sensors
Server administrators that want to check these vital data remotely can also check the “psensors” package that does exactly that.

