Server monitoring with Munin and Monit on CentOS 7.2
In this article, I will describe how you can monitor your CentOS 7 server with Munin and Monit. Munin produces nifty little graphics about nearly every aspect of your server (load average, memory usage, CPU usage, MySQL throughput, eth0 traffic, etc.) without much configuration, whereas Monit checks the availability of services like Apache, MySQL, Postfix and takes the appropriate action such as a restart if it finds a service is not behaving as expected. The combination of the two gives you full monitoring: graphics that lets you recognize current or upcoming problems (like "We need a bigger server soon, our load average is increasing rapidly."), and a watchdog that ensures the availability of the monitored services.
Although Munin lets you monitor more than one server, we will only discuss the monitoring of the system where it is installed here.
This tutorial was written for CentOS 7.2, but the configuration should apply to other distributions like RHEL and Scientific Linux as well.
1 Preliminary Note
Our system's hostname is server1.example.com, and we have a website www.example.com on it with the document root /var/www/html.
2 Enable the EPEL Repository
On CentOS 7, Munin and Monit are not available in the default CentOS repositories. Fortunately, we can install them from EPEL repository. To enable the EPEL repository, we run:
yum -y install epel-release
Import the EPEL GPG-key:
rpm --import /etc/pki/rpm-gpg/RPM-GPG-KEY-EPEL-7
and then run:
yum -y update
to ensure that the system is up to date and that the package list from EPEL is loaded before we start to install munin.
2 Install Apache web server
Munin requires a webserver to serve and display its statistics files. I will install the apache httpd server here:
yum install httpd
Start apache and enable it to be started automatically at boot time.
systemctl enable httpd
systemctl start httpd
4 Install and Configure Munin
To install Munin on CentOS, we do this:
yum -y install munin munin-node
Then we create the system startup links for Munin and start it:
systemctl enable munin-node
systemctl start munin-node
Next, we must edit the Munin configuration file /etc/munin/munin.conf.
nano /etc/munin/munin.conf
We want munin to use the name server1.example.com instead of localhost in the HTML output, therefore we replace localhost with server1.example.com. Without the comments, the changed file looks like this:
[...]
# a simple host tree
[server1.example.com]
    address 127.0.0.1
    use_node_name yes
[...]
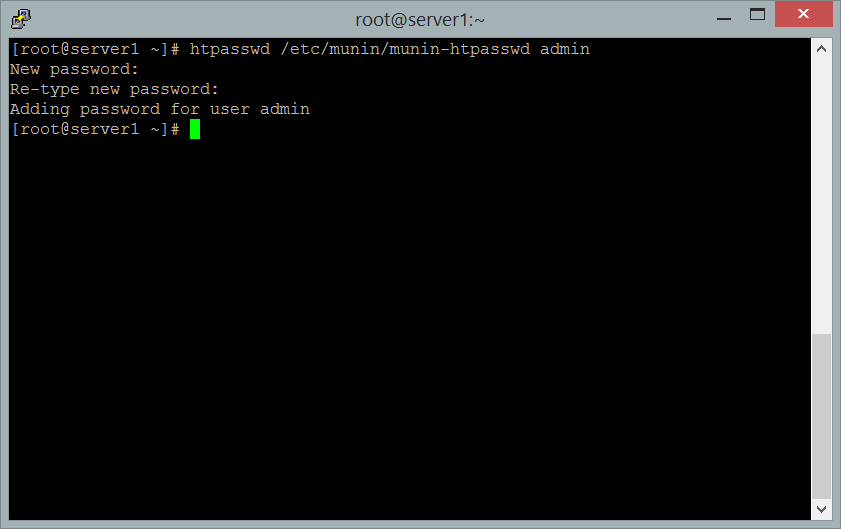
The munin statistics are protected with a username and password (Apache basic auth). In the next step we add a new user and password to the /etc/munin/munin-htpasswd file.
htpasswd /etc/munin/munin-htpasswd admin
The command will add a new user with the name "admin" and prompt twice for the new password.
Now wait a few minutes so that munin can produce the first statistics output, then go to http://server1.example.com/munin/ in your browser, and you see the first statistics.
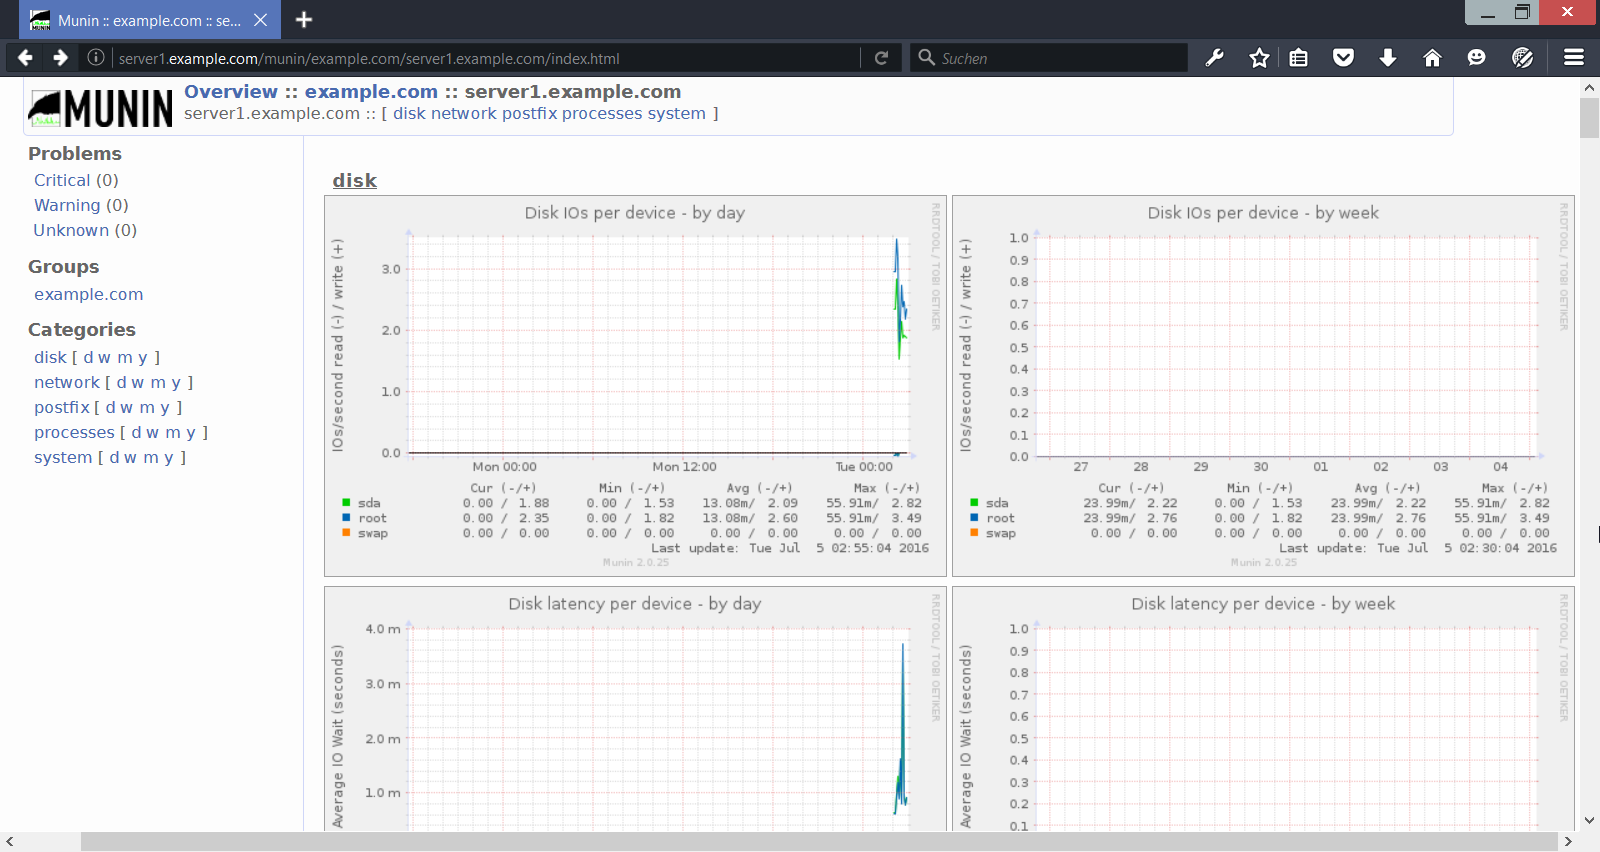
(This is just a small excerpt of the many graphics that munin produces...)

